
When a business operates across multiple locations, performance can vary significantly from one branch to another. One location may consistently receive positive customer feedback, while another may struggle with complaints, low satisfaction scores, or recurring service issues.
Looking only at revenue or sales numbers may not explain why this difference exists. Underperforming locations using feedback data can be identified more accurately by combining customer insights with location-level performance metrics.
Customer feedback can reveal problems with staff interactions, waiting times, service quality, product availability, cleanliness, communication, and other parts of the customer experience.
By analyzing feedback across locations, businesses can identify underperforming locations using feedback data, understand the reasons behind poor performance, and take targeted action.
This makes feedback more than a measurement tool. It becomes an operational tool for improving location-level performance, strengthening customer satisfaction, and creating more consistent experiences across every branch.
What Does an Underperforming Location Mean?
An underperforming location is a branch, store, outlet, facility, or service point that consistently falls below the organization’s expected performance standards.
 Performance can be measured using several indicators, including:
- Customer satisfaction
- NPS
- Customer effort
- Complaint volume
- Negative feedback
- Response times
- Service quality
- Repeat visits
- Customer retention
- Operational KPIs
Importantly, an underperforming location does not necessarily have the lowest sales.
A location may generate strong revenue but still have declining customer satisfaction.
Another location may have average sales but a growing number of complaints.
This is why businesses need to combine operational data with feedback data.
Why Feedback Data Matters for Multi-Location Businesses
When businesses operate across multiple locations, customer experience can become inconsistent.
Different branches may have:
- Different managers
- Different staffing levels
- Different customer volumes
- Different operating processes
- Different local conditions
- Different training levels
- Different service standards
These differences can affect how customers perceive the brand.
For example, imagine a restaurant chain with 20 locations.
Nineteen branches maintain an average CSAT of 4.5 out of 5.
One branch consistently scores 3.2.
The difference is significant.
But the score alone does not tell management what is wrong.
Customer comments might reveal:
- Long waiting times
- Staff shortages
- Slow order processing
- Poor cleanliness
- Incorrect orders
Feedback helps turn a performance gap into an actionable problem.
1. Establish a Common Feedback Measurement Framework

Before comparing locations, businesses need consistent measurement.
If every branch uses different questions, scales, or feedback methods, comparisons can become unreliable.
A common framework might include:
CSAT
Customer Satisfaction Score can help measure satisfaction after a specific interaction.
NPS
Net Promoter Score can provide insight into customer loyalty and willingness to recommend the business.
CES
Customer Effort Score can help measure how easy or difficult it was for customers to complete a task.
Complaint Rate
This shows how frequently customers report problems.
Resolution Time
This measures how quickly customer issues are addressed.
Businesses can combine these metrics with operational KPIs to create a broader location performance view.
2. Compare Locations Using the Same Metrics
Once the measurement framework is consistent, businesses can compare locations.
For example:
| Location | CSAT | NPS | Complaints | Avg. Resolution Time |
| Location A | 4.7 | 62 | 18 | 3 hrs |
| Location B | 4.5 | 55 | 24 | 4 hrs |
| Location C | 3.4 | 21 | 67 | 12 hrs |
| Location D | 4.6 | 58 | 20 | 3 hrs |
Location C stands out.
Its CSAT and NPS are lower, while complaint volume and resolution time are higher.
This does not automatically explain the cause, but it tells management where deeper investigation is needed.
3. Look for Consistent Patterns
One poor survey response does not necessarily indicate an underperforming location.
Feedback should be analyzed over time.
Look for patterns such as:
- Consistently low satisfaction
- Increasing complaint volume
- Declining NPS
- Repeated negative comments
- Increasing service-related complaints
- Longer resolution times
- Declining feedback response rates
A location that performs poorly for one week may simply have experienced an unusual event.
A location that performs poorly for several months requires closer attention.
This is why feedback trends are often more useful than individual responses.
4. Analyze Feedback by Location
Location-level analysis allows businesses to identify geographic or branch-specific problems.
For example, management might discover:
Location A: Customers complain about waiting times.
Location B: Customers complain about staff communication.
Location C: Customers complain about product availability.
Location D: Customers are generally satisfied.
This information allows the business to avoid applying the same solution everywhere.
Each location can receive an action plan based on its actual customer feedback.
5. Use Customer Comments to Understand the “Why”
Scores tell you what is happening.
Comments can help explain why it is happening.
Suppose a location has a CSAT score of 3.1.
That number tells management there is a problem.
Now consider these customer comments:
- “Had to wait 30 minutes.”
- “Only one employee was available.”
- “Nobody informed us about the delay.”
- “The service was slow during peak hours.”
A pattern begins to emerge.
The problem may not be general service quality.
It may be staffing and communication during busy periods.
This distinction matters because the solution depends on the root cause.
6. Categorize Feedback by Issue
Manually reading thousands of comments can be difficult.
Businesses can categorize feedback into themes such as:
- Staff behavior
- Waiting time
- Product quality
- Product availability
- Cleanliness
- Pricing
- Billing
- Delivery
- Technical issues
- Communication
- Service quality
Once feedback is categorized, managers can compare issue frequency between locations.
For example:
| Issue | Location A | Location B | Location C |
| Waiting time | 12 | 8 | 47 |
| Staff behavior | 6 | 29 | 14 |
| Product availability | 4 | 7 | 35 |
| Billing | 3 | 5 | 9 |
This makes operational problems easier to identify.
7. Track Negative Feedback Trends
A location may not have the lowest overall satisfaction score but could still be moving in the wrong direction.
For example:
January: 4.5 CSAT
February: 4.4 CSAT
March: 4.1 CSAT
April: 3.8 CSAT
The decline is important.
Management should investigate what changed during this period.
Possible causes could include:
- New staff
- Management changes
- Higher customer volume
- Product changes
- Operational disruption
- Reduced staffing
- New competitors
- Process changes
Trend analysis helps businesses identify problems before they become larger customer experience issues.
8. Compare Locations Against Benchmarks
A location should not be evaluated only against the company’s overall average.
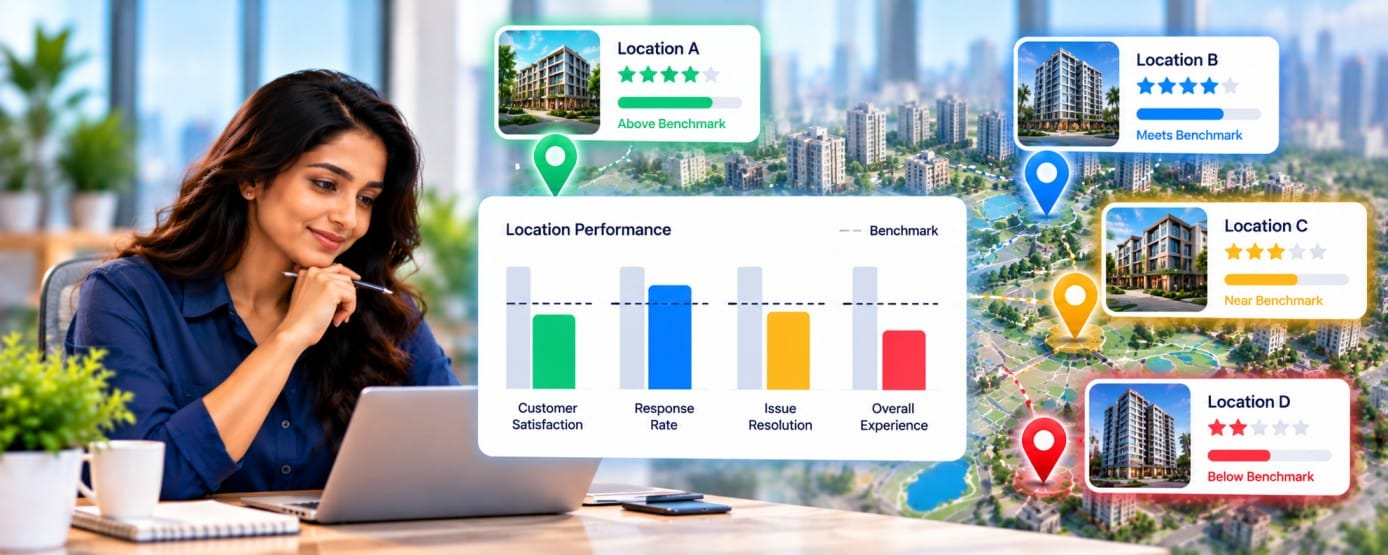 It can also be compared against:
- Regional averages
- Location type
- Historical performance
- Similar branches
- Target performance
- Peer locations
For example, a high-volume city-center store may naturally have longer waiting times than a smaller suburban branch.
Comparing them without considering context could produce misleading conclusions.
A more useful approach is to compare locations with similar operating conditions.
9. Identify Outliers
Outlier analysis can help management quickly identify locations that behave differently from the rest of the network.
Suppose 30 locations have CSAT scores between 4.2 and 4.7.
One location scores 3.3.
That location deserves investigation.
However, the purpose of identifying an outlier is not to label the branch as “bad.”
Instead, it is to ask:
What is different about this location?
This mindset encourages problem-solving rather than blame.
10. Use Real-Time Feedback Alerts
Historical reports are useful, but businesses should not always wait until the end of the month to discover a serious issue.
Real-time feedback alerts can notify teams when certain conditions occur.
For example:
- Very low CSAT score
- Negative sentiment
- Serious complaint
- Repeated complaint
- Specific issue keyword
- High-priority customer feedback
This allows managers to investigate problems sooner.
Real-time feedback is particularly useful for businesses where customer experience can change quickly during the day.
11. Combine Feedback Data With Operational Data
Feedback becomes more powerful when combined with operational information.
For example:
Feedback Data
- CSAT
- NPS
- Complaints
- Customer comments
Operational Data
- Staffing levels
- Sales
- Footfall
- Waiting time
- Inventory
- Transaction volume
- Resolution time
Now consider a location with:
- High customer volume
- Low staffing
- Long waiting times
- Declining CSAT
- Increasing complaints
The relationship becomes easier to investigate.
Feedback provides the customer perspective, while operational data provides additional context.
12. Look Beyond Average Scores
Average scores can hide important details.
Suppose a location has a CSAT of 4.2.
That looks reasonable.
But further analysis may show:
- 80% of customers are highly satisfied
- 10% are neutral
- 10% are extremely dissatisfied
The average does not fully communicate the severity of those negative experiences.
Businesses should therefore analyze:
- Score distribution
- Negative response percentage
- Complaint categories
- Customer comments
- Sentiment
- Trends
- Repeat complaints
This creates a more complete picture of location performance.
13. Analyze Detractors Separately
NPS can help businesses identify customers who are dissatisfied enough to become detractors.
Studying these responses separately can reveal location-specific problems.
For example, one branch might have a high percentage of detractors because of:
- Slow service
- Poor staff interaction
- Product issues
- Inconsistent service
Understanding detractors can help businesses identify the experiences most likely to damage loyalty.
14. Turn Location Insights Into Action Plans
Identifying an underperforming location is only the beginning.
The next step is action.
A simple framework is:
Identify → Investigate → Act → Measure
Identify
Find the location with unusual or declining performance.
Investigate
Analyze comments, issue categories, trends, and operational data.
Act
Create a targeted improvement plan.
Measure
Track the location’s performance after the intervention.
For example:
Problem: Long waiting times
Possible cause: Insufficient staffing during peak hours
Action: Adjust staffing schedule
Measurement: Track waiting time and CSAT for the next four weeks
This turns feedback into measurable improvement.
15. Monitor Whether Improvements Actually Work
An action plan should not be considered successful simply because it was implemented.
The business should measure the outcome.
For example:
Before improvement
- CSAT: 3.5
- Complaints: 72
- Average wait: 18 minutes
After improvement
- CSAT: 4.2
- Complaints: 41
- Average wait: 10 minutes
This provides evidence that the intervention may have improved the customer experience.
The same approach can be applied to staffing, training, product availability, communication, or other location-specific issues.
Common Mistakes When Comparing Locations
Comparing locations without context
Different locations may serve different customer segments or operate under different conditions.
Focusing only on averages
Average scores can hide serious negative experiences.
Ignoring customer comments
Numbers show the performance gap. Comments can help explain it.
Reacting to one bad response
A single complaint should not automatically define a location’s performance.
Waiting too long to investigate
Declining trends should be investigated before they become persistent.
Creating the same action plan for every location
Different problems require different solutions.
Measuring improvement only once
Performance should be tracked over time to determine whether changes are sustained.
How Centralized Feedback Helps Multi-Location Businesses
Managing feedback across multiple branches can become difficult when every location operates separately.
A centralized approach gives management a broader view of customer experience across the network.
It can help teams:
- Compare locations
- Monitor trends
- Identify recurring issues
- Track complaints
- Detect outliers
- Assign cases
- Monitor resolutions
- Share best practices
For businesses with multiple branches, centralized feedback management can help turn location-level responses into organization-wide insights. The piHappiness guide on multi-location customer feedback management discusses how centralized insights can improve visibility, complaint handling, and consistency across locations.
How to Create a Location Performance Dashboard
A location feedback dashboard should make important differences easy to see.
Useful dashboard components include:
Location Scorecard
Show each location’s:
- CSAT
- NPS
- CES
- Complaint rate
- Resolution time
Trend Charts
Track whether each metric is improving or declining.
Location Comparison
Compare branches using the same KPIs.
Issue Breakdown
Show the most common complaint categories.
Sentiment Analysis
Identify positive, neutral, and negative feedback trends.
Open Cases
Display unresolved complaints requiring attention.
Alerts
Highlight locations that cross predefined thresholds.
The objective is simple:
Help managers see where attention is needed without manually reviewing thousands of responses.
Use Feedback From High-Performing Locations Too
Location analysis should not focus only on problems.
High-performing branches can provide useful lessons.
Suppose Location A consistently receives strong feedback about employee service.
Management can investigate:
- How employees are trained
- How managers communicate expectations
- How customer issues are handled
- What processes are different
- How staff respond to complaints
These practices can potentially be shared with other locations.
This turns feedback analysis into a way to identify and replicate successful practices.
Feedback data can help businesses identify underperforming locations before problems become more difficult to solve.
The key is to look beyond a single score.
Compare locations using consistent metrics. Study trends instead of isolated responses. Analyze customer comments to understand root causes. Combine feedback with operational data. Then turn those insights into targeted action plans.
Most importantly, location performance should be viewed as an opportunity to improve rather than simply a ranking exercise.
A branch with declining customer satisfaction is telling the business something.
The role of feedback analysis is to understand that signal, identify the underlying issue, take action, and measure what changes.
When businesses create this continuous feedback loop, they can improve consistency across locations while also giving individual branches the support they need to deliver better customer experiences.
Frequently Asked Questions
- How can feedback data identify underperforming locations?
Businesses can compare customer satisfaction, NPS, complaints, sentiment, resolution time, and other feedback metrics across locations to identify branches with consistently weaker or declining performance.
- What feedback metrics should businesses compare across locations?
Common metrics include CSAT, NPS, CES, complaint volume, negative feedback rate, resolution time, and customer sentiment.
- Should businesses compare all locations against the same benchmark?
A common measurement framework is useful, but businesses should also consider differences in customer segments, location type, operating conditions, and customer volume.
- Why are customer comments important when analyzing locations?
Scores can identify a performance gap, while customer comments can provide context about why customers are dissatisfied.
- How can businesses identify recurring problems at a location?
Categorizing feedback by themes such as waiting time, staff behavior, product quality, billing, and service issues can reveal recurring patterns.
- How often should businesses analyze location feedback?
The ideal frequency depends on feedback volume and business type. High-volume businesses may benefit from real-time monitoring and regular reviews, while lower-volume locations may use weekly or monthly analysis.
- Can real-time alerts help identify underperforming locations?
Yes. Alerts can notify managers when a location receives unusually negative feedback, a serious complaint, or repeated low scores.
- Should businesses focus only on locations with low scores?
No. Declining trends, increasing complaints, or emerging negative themes can be important even when a location’s current average score appears acceptable.
- How can businesses find the root cause of poor location performance?
They can combine feedback scores, customer comments, issue categories, sentiment, operational metrics, staffing information, and historical trends.
- How can high-performing locations help improve weaker locations?
Businesses can study the processes, training, management practices, and customer service approaches used by high-performing locations and determine which practices can be adapted elsewhere.
- What is a location feedback dashboard?
A location feedback dashboard brings important customer experience metrics into one view so managers can compare branches, monitor trends, identify problems, and track improvement.
- How can businesses turn location feedback into action?
A practical approach is to identify the performance gap, investigate its root cause, create a targeted action plan, and measure the results over time.