Customer expectations are higher than ever. Patients expect smoother care journeys. Guests expect faster and friendlier service. Employees expect better communication and workplace culture.
Yet many organizations still manage feedback in disconnected ways impacting feedback analytics subsequently.
A hospital tracks complaints in spreadsheets.
A restaurant checks reviews manually.
An office runs occasional employee surveys.
The result is fragmented data, slow action, and missed opportunities.
Modern organizations need a smarter approach. They need one place to see what people are experiencing, where issues are happening, and what needs attention now.
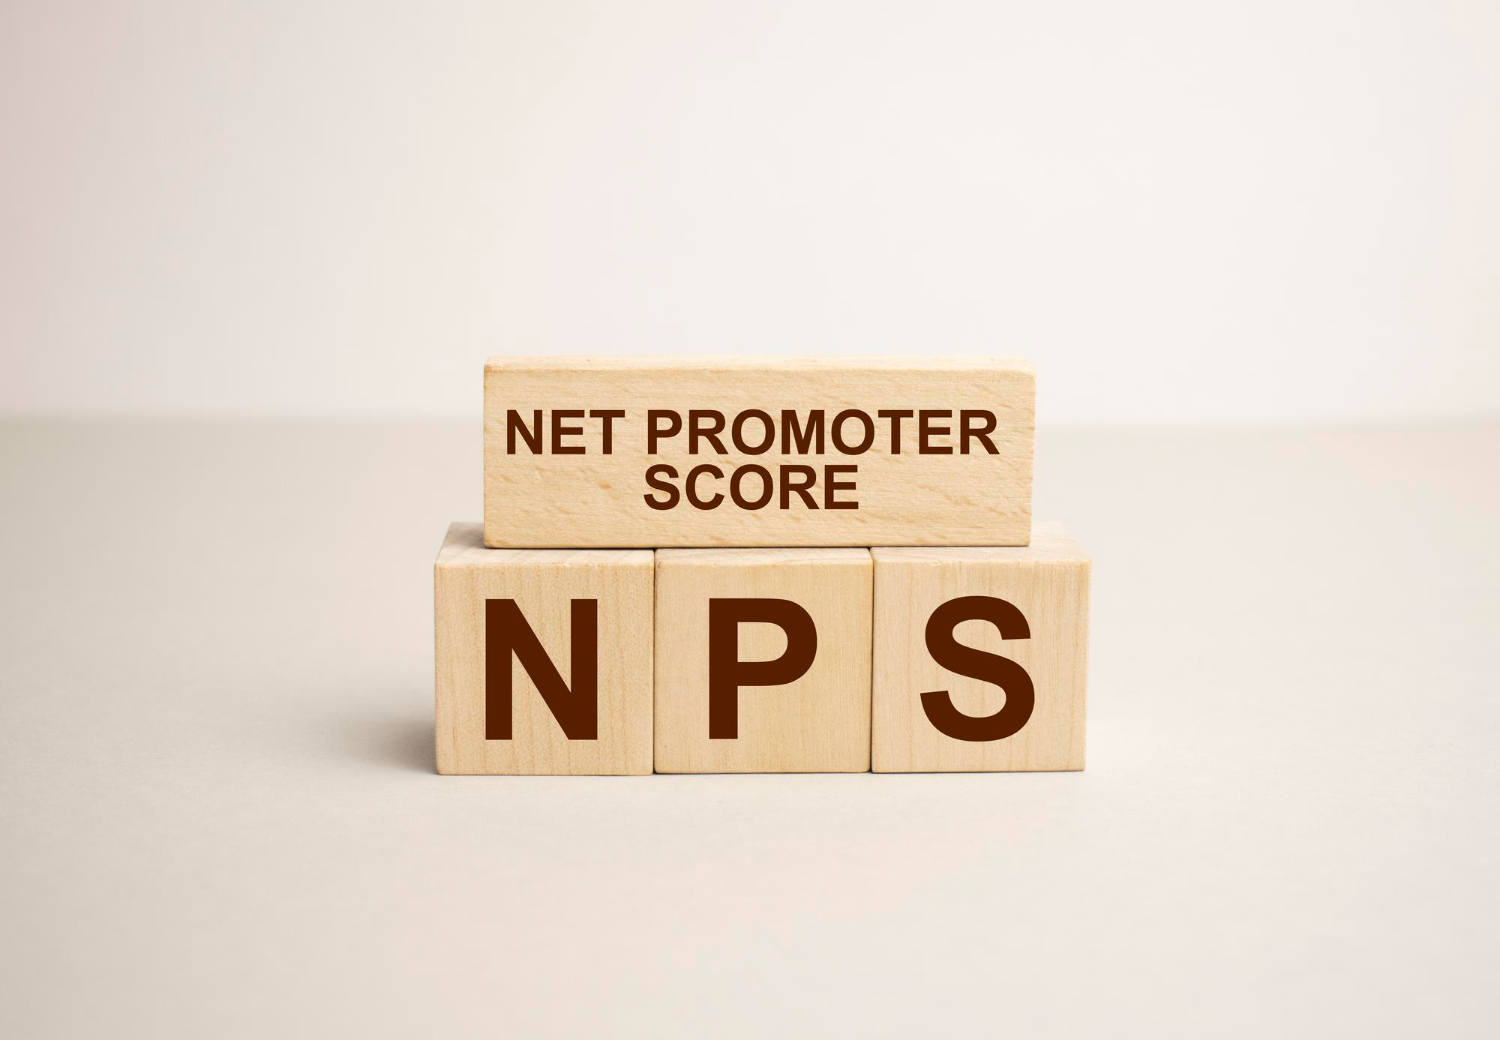
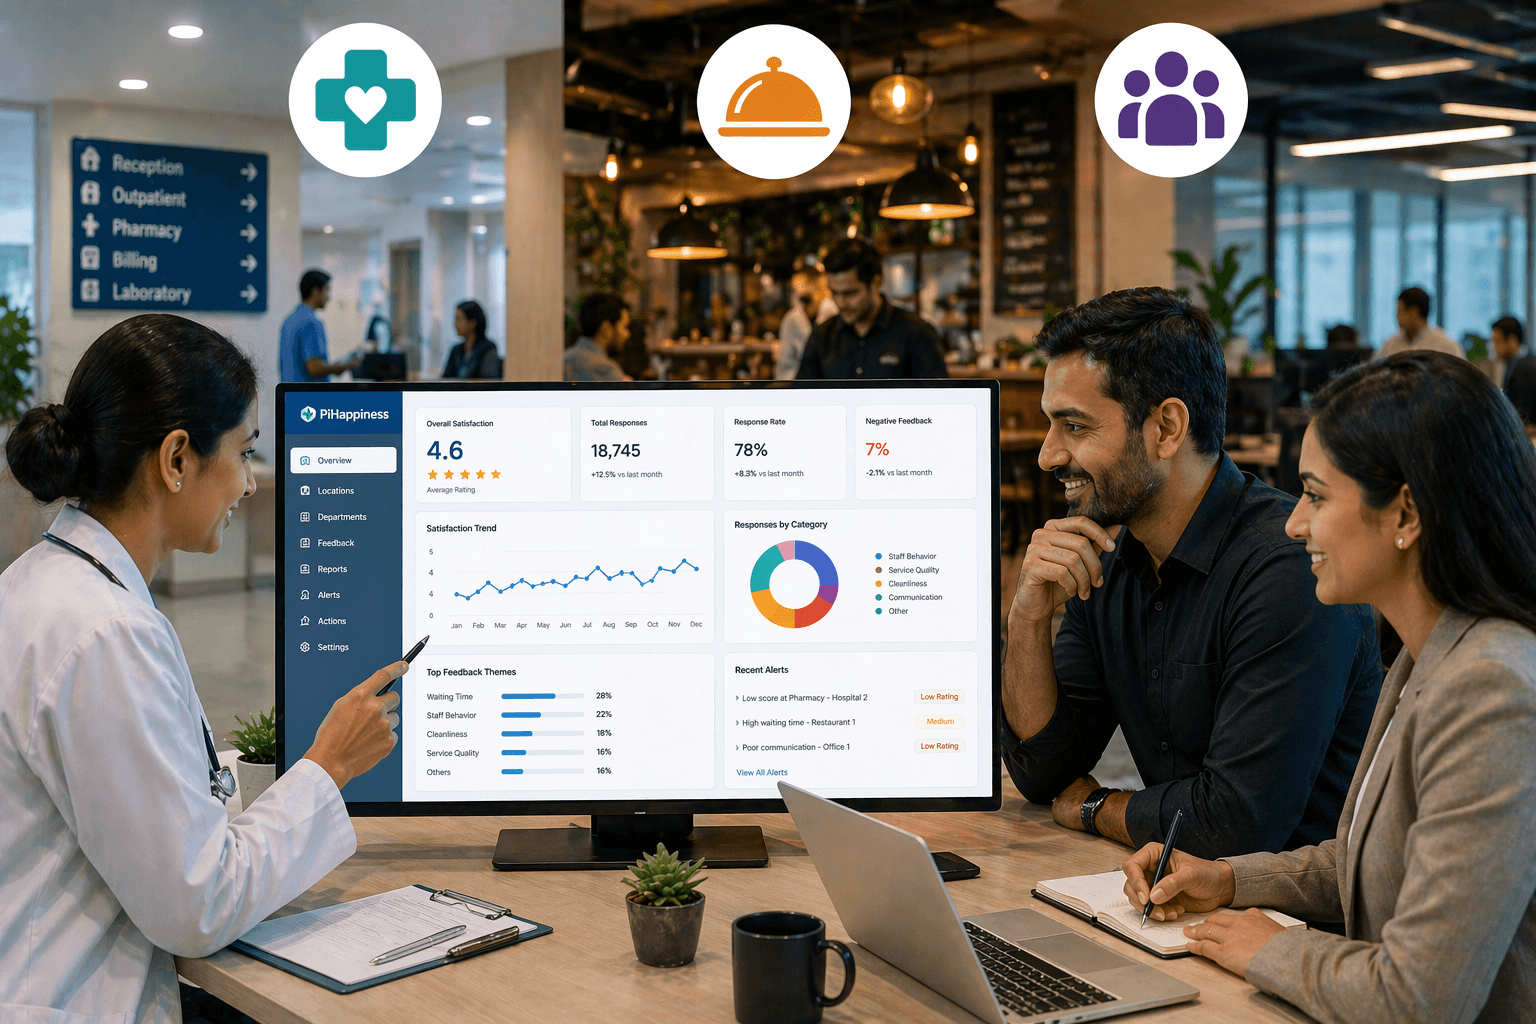
That is where a centralized feedback dashboard becomes powerful.
With PiHappiness, organizations across healthcare, hospitality, and workplaces can capture feedback in real time and manage it through one intelligent dashboard.
Why Feedback Data Often Gets Lost
Most businesses collect some form of feedback. The real challenge is what happens after collection.
Common problems include:
- Feedback stored in multiple tools
- No visibility across branches
- Slow manual reporting
- No ownership of issues
- Difficulty spotting trends
- Low response follow up
- Decisions based on assumptions
When data is scattered, improvement becomes reactive instead of proactive.
Why One Dashboard Changes Everything
A centralized dashboard turns responses into decisions.
Instead of reviewing dozens of files, emails, and reports, leaders can instantly see:
- Satisfaction scores by location
- Trends over time
- Top complaints
- High performing branches
- Department level issues
- Staff performance patterns
- Response rates
- Areas needing urgent action
This creates speed, accountability, and clarity.
Healthcare: Better Visibility Into Patient Experience
In hospitals and clinics, feedback often comes from multiple touchpoints:
- Reception
- Waiting areas
- Consultation
- Pharmacy
- Billing
- Discharge
- Follow up communication
Without a dashboard, leadership may only hear about problems when negative reviews appear online making feedback analytics skewed.
With one dashboard, healthcare teams can track:
- Waiting time satisfaction
- Staff courtesy
- Cleanliness scores
- Billing experience
- Department performance
- Branch comparisons
- Recovery actions taken
This helps improve patient trust and operational quality.
Hospitality: Better Guest Experience at Every Location
For restaurants, hotels, cafes, and service venues, experience can change hour by hour.
One poor shift can create multiple negative reviews.
A dashboard helps hospitality teams monitor:
- Food quality feedback
- Speed of service
- Staff friendliness
- Cleanliness ratings
- Table turnover issues
- Branch consistency
- Repeat guest sentiment
Managers can compare locations, identify weak shifts, and act faster.
For growing brands with multiple outlets, this visibility is critical.
Workplaces: Better Employee Experience and Retention
In offices, feedback is often delayed or underreported hence changing the feedback analytics scenario.
Employees may stay silent about issues until disengagement becomes visible through poor performance or resignations.
A centralized dashboard gives HR and leadership teams visibility into:
- Employee happiness scores
- Team morale trends
- Manager feedback
- Workload concerns
- Onboarding experience
- Burnout indicators
- Engagement by department
- Exit survey patterns
Instead of waiting for attrition data, companies can act earlier.
Why Multi Location Businesses Benefit Most
The bigger the organization, the bigger the blind spots.
When multiple branches operate independently, service quality often becomes inconsistent.
One location performs well. Another struggles. Leadership lacks real time visibility.
A single dashboard helps standardize performance by showing:
- Which branch leads in satisfaction
- Which branch needs support
- Common complaints across all sites
- Regional trends
- Monthly progress
- Improvement opportunities
This is how brands scale quality, not just growth.
How PiHappiness Makes It Simple
PiHappiness is built for organizations that want smarter feedback analytics management across industries.
It helps businesses collect feedback internally and immediately, then convert responses into clear action.
Core Capabilities
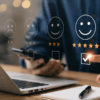
Real Time Feedback Collection and Feedback Analytics
Capture responses through kiosks, tablets, QR surveys, mobile links, and web forms.
Unified Dashboard
View all branches, departments, and teams in one place.
Smart Reports
Track patterns, recurring complaints, and progress over time.
Alerts and Escalations
Low ratings can be flagged instantly for quick recovery.
Works Offline
Ideal for hospitals, restaurants, events, and busy service environments.
Easy Decision Making
Move from guesswork to evidence based action.
Real World Example
Imagine a company operating:
- 3 hospitals
- 8 restaurants
- 2 corporate offices
Without one dashboard, feedback and analytics live in separate systems.
With PiHappiness, leadership can log in and instantly compare satisfaction scores, complaints, branch trends, and urgent issues across all units.
That is operational intelligence in real time.
External Link Paragraph
According to customer experience research, organizations that unify customer insights across teams and locations are better positioned to improve satisfaction, loyalty, and business performance. Centralized visibility helps leaders act faster and make more confident decisions. Read more in Qualtrics’ guide to experience management:
Final Thoughts
Feedback is valuable only when it is visible, understood, and acted on quickly. That’s why we shed light on feedback analytics.
Healthcare providers, hospitality brands, and modern workplaces no longer need separate systems for each location or department.
With one dashboard, leaders gain the clarity to improve experiences at scale.